Wooden Nickels
 Tuesday, August 6, 2013 at 1:49PM
 It ain't what you don't know that gets you into trouble. It's what you know for sure that just ain't so. ~ Mark Twain
In theory there is no difference between theory and practice. In practice there is. ~ Yogi Berra
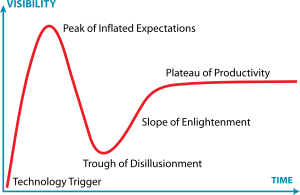
I love Big Data analysis -- the prospect that from mighty oaks of data tiny acorns of insight might be gathered. As much as I love it, I expect that the Gartner Hype Cycle will eventually catch up with it, and here I'm going to make a breathless prediction -- that the Big Data "Trough of Disillusionment" will soon be upon us.
I'm not predicting these analytics sloughs of despond willy-nilly - here the trough will come because of the meshing of 4 specific leading indicators:
- The Early Adopters (Google with MapReduce, Progressive Insurance with insurance updates for every car, every night, etc.) have succeeded, been recognized and rewarded. The pioneering innovators are doing a victory-lap.
- Early Majority applications (IBM's Jeopardy-winning Watson, running on $3M of hardware) are HARD
- Everybody is in the game now, but major new wins are scarce
- It's easy to fudge - with Big Data / MapReduce data provenance is nonexistent, and all results (even nonsensical ones) can be taken as "valid" if big-enough, complex-enough solutions produced them...
- Lots of money has been bet on Early Majority solutions (I've been writing about them for four years now), and the bets are still out there...
With this type of dynamic, we might expect a couple of things to happen now:
- Outcomes start to become selected before there are data sets to justify them, and
- Managers and executives start learning how to properly question results
My posting last week Glittering Data was the start of a set of posts on how to judge Big Data results -- it talked about data sets that can be shown to have no magic numbers in them. This post is about "wooden nickels" - how to know whether to trust Big Systems or our lying eyes when our results are different from the facts. So let's get started...
In our last, Glittering Data posting we talked about the T-Distribution calculation, and in that example we used it to show that sometimes there really isn't a pony there. We can also use it to show the opposite. Our data might contain magic numbers, just not the magic numbers that we were hoping for...
Let's take a marketing example: You've been running pilot tests of your new car, and you've been collecting data from focus groups, interviews and social media sources. Everybody loves your new car! The data back from your Marketing group shows a clear winner .. then you decide to do some drill-downs...
You start worrying with your first look into the drill-downs. According to Marketing, 70% of pilot customers loved your car - rating it an average of 4 (out of 5) on their scale. But when you dug into individual surveys the results were a bit different: the first dozen reviewers you read hated it, rating it only 2 our of 5. Can these results be real? Let's see what our test shows...
In our T-distribution calculation, we have 10,000 inputs collected with an average of 4 and a standard deviation of 1.3. The first dozen "actuals" you reviewed have a mean of 2.0 and a standard deviation of 1.3. Can such results legitimately have come at random from our larger data set?
Here's what our T-distribution shows:

We might be fine if our test sample failed at 80% confidence interval. Even 90% or 95% might be easily explained away by the way we grabbed our sample. But our tests show that our sample represents different data, at 99.9% confidence interval! Time to take a hard look at the numbers...
There are several explanation that might explain such a discrepancy, such as
- Our sample was drawn from pre-sorted data, so our results are not randomly selected
- Sample bias - our sample was drawn from a user set prejudicially disposed against our product
- Various mathematical errors, in either our calculation or the data selection
But there could be other, darker causes at work
- Someone (like Gregor Mendel, with his pea-plants) "pinched" the results to be more to our liking
This is where data provenance (still a novelty in Big Data analysis) will be so valuable:
- Yes - drill-down data can differ from the general Big Data population, but
- No - the laws of statistics still apply, and if our actuals are that different from our expectations from greater population, then we need to take a hard look somewhere.
In data, getting Trustworthy will be even more important than getting Big was.
The great enemy of the truth is very often not the lie — deliberate, contrived, and dishonest — but the myth — persistent, persuasive and realistic. ~ John F. Kennedy
 John Repko | Comments Off |


